Predistribution vs. Redistribution

Notebook 02: Predistribution vs. Redistribution

Does Europe achieve equality through market income or welfare state redistribution?

The conventional story says Europe is more equal because European governments tax and transfer more aggressively. But Blanchet, Chancel & Gethin (2022) argue that the key driver is actually predistribution — Europe’s labor markets, wage-setting institutions, and education systems produce more equal pre-tax incomes in the first place.

The debate

Blanchet et al. (AEJ: Applied, 2022): “The US actually redistributes a greater share of national income to low-income groups than any individual European country.” Europe’s lower inequality comes primarily from more equal market incomes, not from redistribution.

Bruenig (People’s Policy Project, 2022) critique: Blanchet et al. classify social insurance (unemployment benefits, pensions, disability payments) as pre-tax income rather than redistribution. This effectively “defines the welfare state out of existence” — since those programs ARE the European welfare state.

The underlying conceptual issue

Where you draw the line between “market” and “state” determines the answer. If publicly-mandated social insurance is market income (because it’s contribution-based), then Europe achieves equality through markets. If it’s redistribution (because it’s tax-funded and state-mandated), then the welfare state does the work.

Show code
import sys
sys.path.insert(0, '..')

import pandas as pd
import numpy as np
import matplotlib.pyplot as plt
import matplotlib.ticker as mtick
import seaborn as sns

from data.config import FOCUS_COUNTRIES, EXTENDED_COUNTRIES, COUNTRY_NAMES
from data.plotting import (set_style, country_color, country_name,
                           slope_chart, save_figure, annotate_countries)
from data import swiid, wid

set_style()

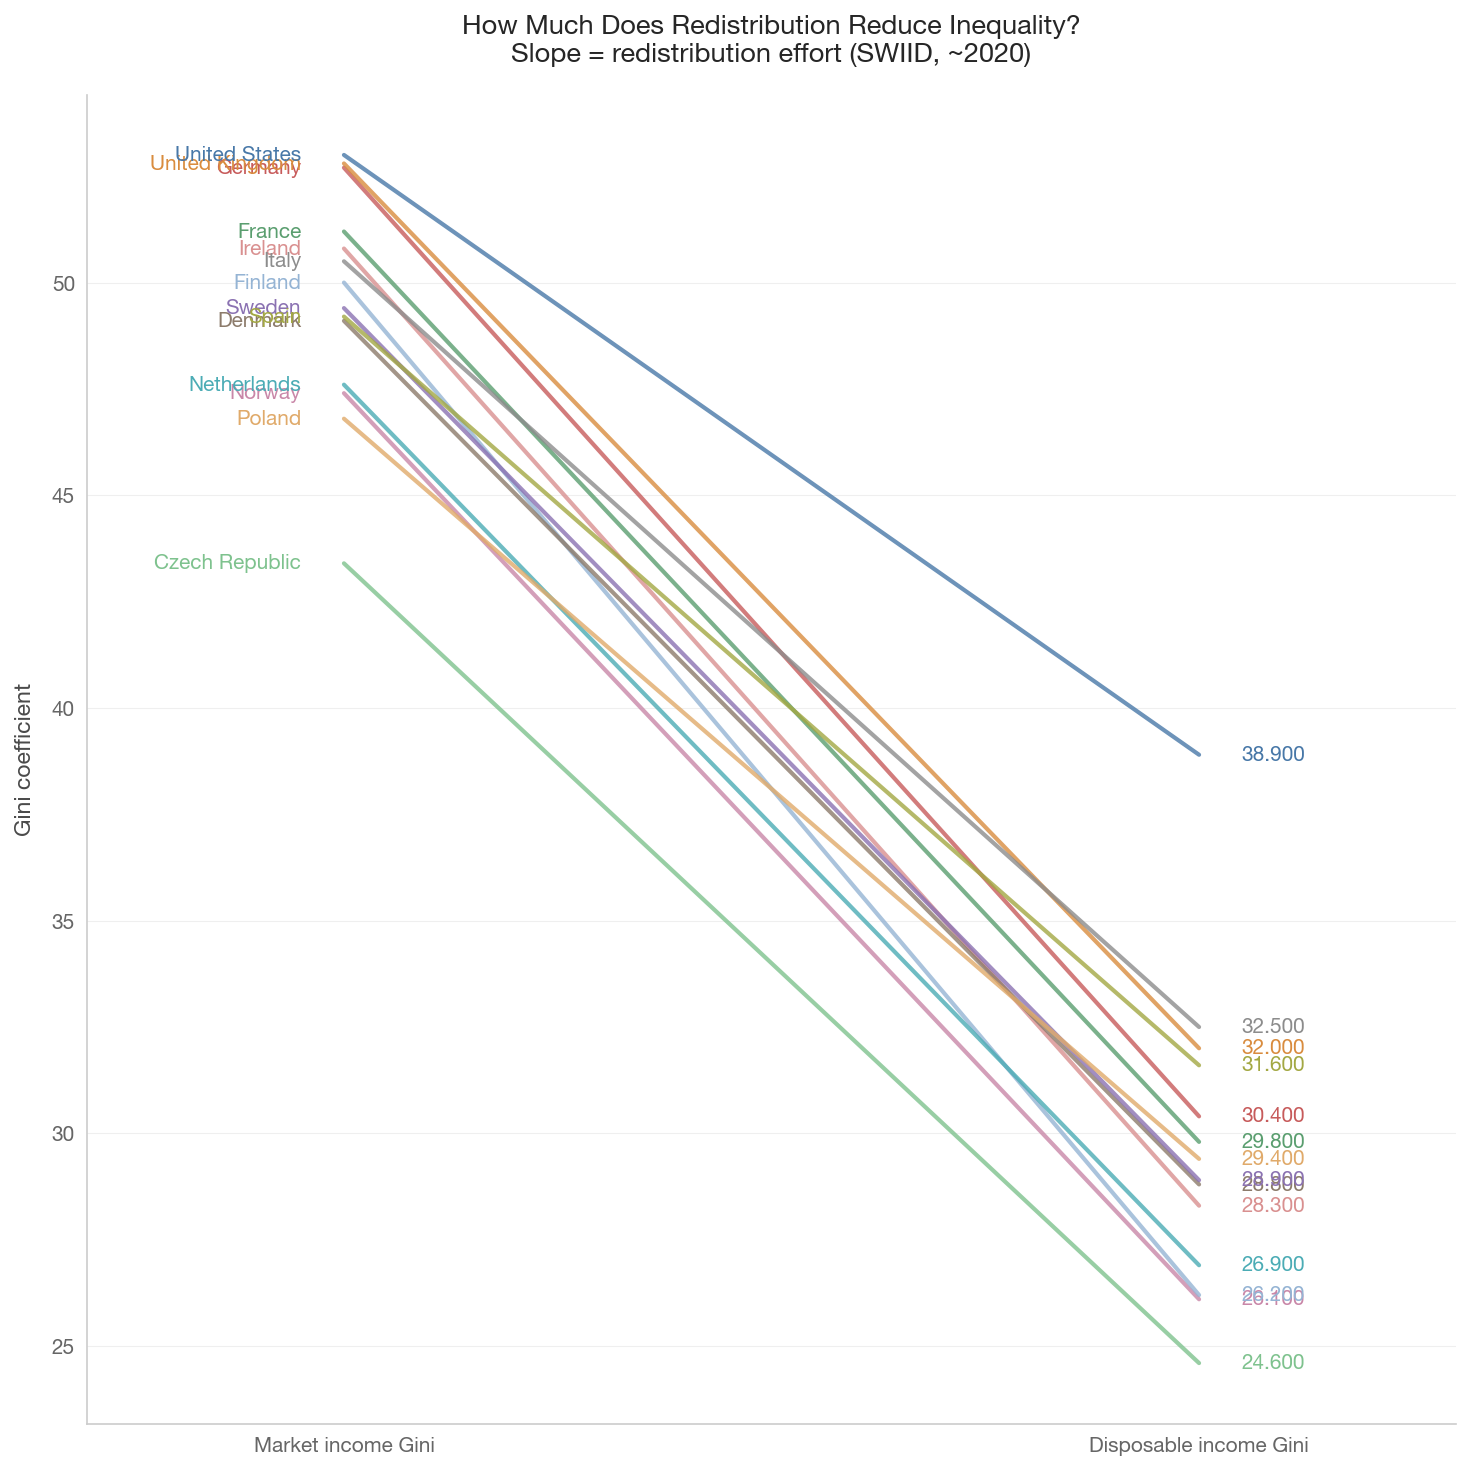
1. Slope Chart: Market Gini → Disposable Gini

Each line connects a country’s market income Gini (left) to its disposable income Gini (right). Steeper slopes = more redistribution.

Notice that Nordic countries have moderate market inequality but steep slopes (heavy redistribution), while Anglo-Saxon countries have high market inequality and shallower slopes.

Show code
redist = swiid.get_redistribution(EXTENDED_COUNTRIES,
                                   start_year=2017, end_year=2022)

if not redist.empty:
    # Take most recent year per country
    latest = (redist.sort_values('year', ascending=False)
              .groupby('country_code').first().reset_index())
    latest = latest.dropna(subset=['gini_mkt', 'gini_disp'])
    latest = latest[latest['country_code'] != '']  # Remove unmapped
    latest = latest.sort_values('gini_disp')  # Sort by final inequality
    
    fig, ax = plt.subplots(figsize=(10, 10))
    slope_chart(ax,
                latest['gini_mkt'].values,
                latest['gini_disp'].values,
                latest['country_code'].values,
                left_label='Market income Gini',
                right_label='Disposable income Gini')
    
    ax.set_title('How Much Does Redistribution Reduce Inequality?\n'
                 'Slope = redistribution effort (SWIID, ~2020)', fontsize=13)
    plt.tight_layout()
    save_figure(fig, '02_slope_chart_redistribution')
    plt.show()
else:
    print("SWIID redistribution data not available.")


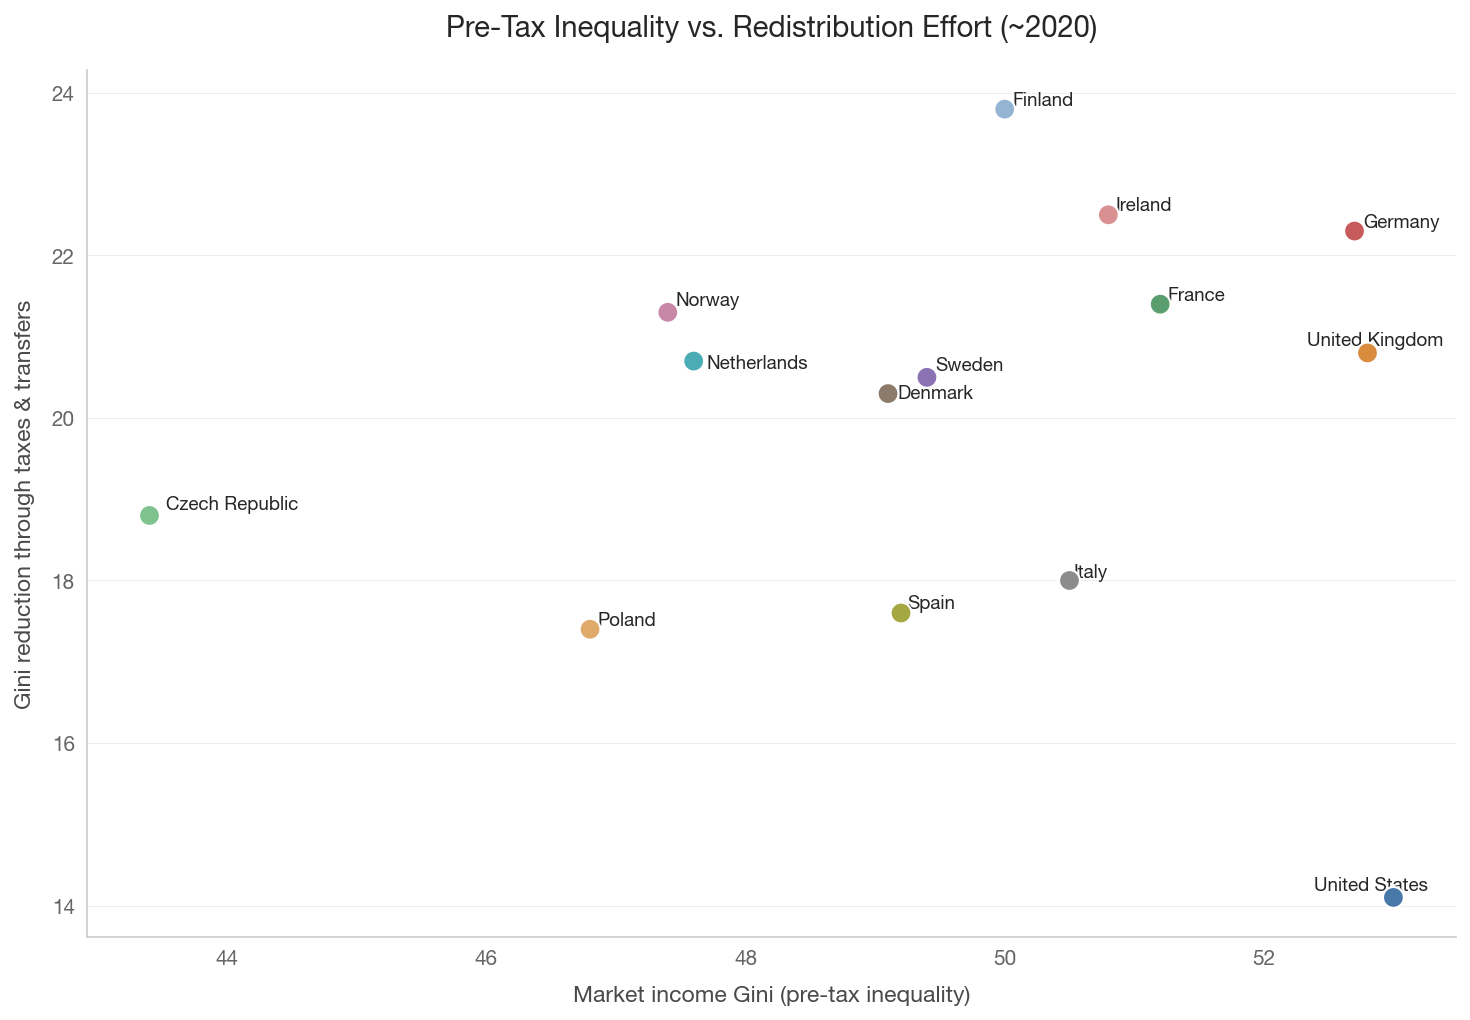
2. Redistribution Scatter: Pre-tax Inequality vs. Redistribution Magnitude

x-axis: How unequal is the market income distribution? y-axis: How much does the tax-transfer system reduce inequality?

The US sits in a distinctive position: high pre-tax inequality, moderate redistribution.

Show code
if not redist.empty:
    latest = (redist.sort_values('year', ascending=False)
              .groupby('country_code').first().reset_index())
    latest = latest.dropna(subset=['gini_mkt', 'gini_disp'])
    latest = latest[latest['country_code'] != '']
    latest['abs_reduction'] = latest['gini_mkt'] - latest['gini_disp']
    
    fig, ax = plt.subplots(figsize=(10, 7))
    
    colors = [country_color(c) for c in latest['country_code']]
    ax.scatter(latest['gini_mkt'], latest['abs_reduction'],
               c=colors, s=100, zorder=5, edgecolors='white', linewidth=1)
    
    annotate_countries(ax, latest['gini_mkt'].values,
                       latest['abs_reduction'].values,
                       latest['country_code'].values)
    
    ax.set_xlabel('Market income Gini (pre-tax inequality)')
    ax.set_ylabel('Gini reduction through taxes & transfers')
    ax.set_title('Pre-Tax Inequality vs. Redistribution Effort (~2020)', fontsize=14)
    
    plt.tight_layout()
    save_figure(fig, '02_redistribution_scatter')
    plt.show()
else:
    print("SWIID data not available.")


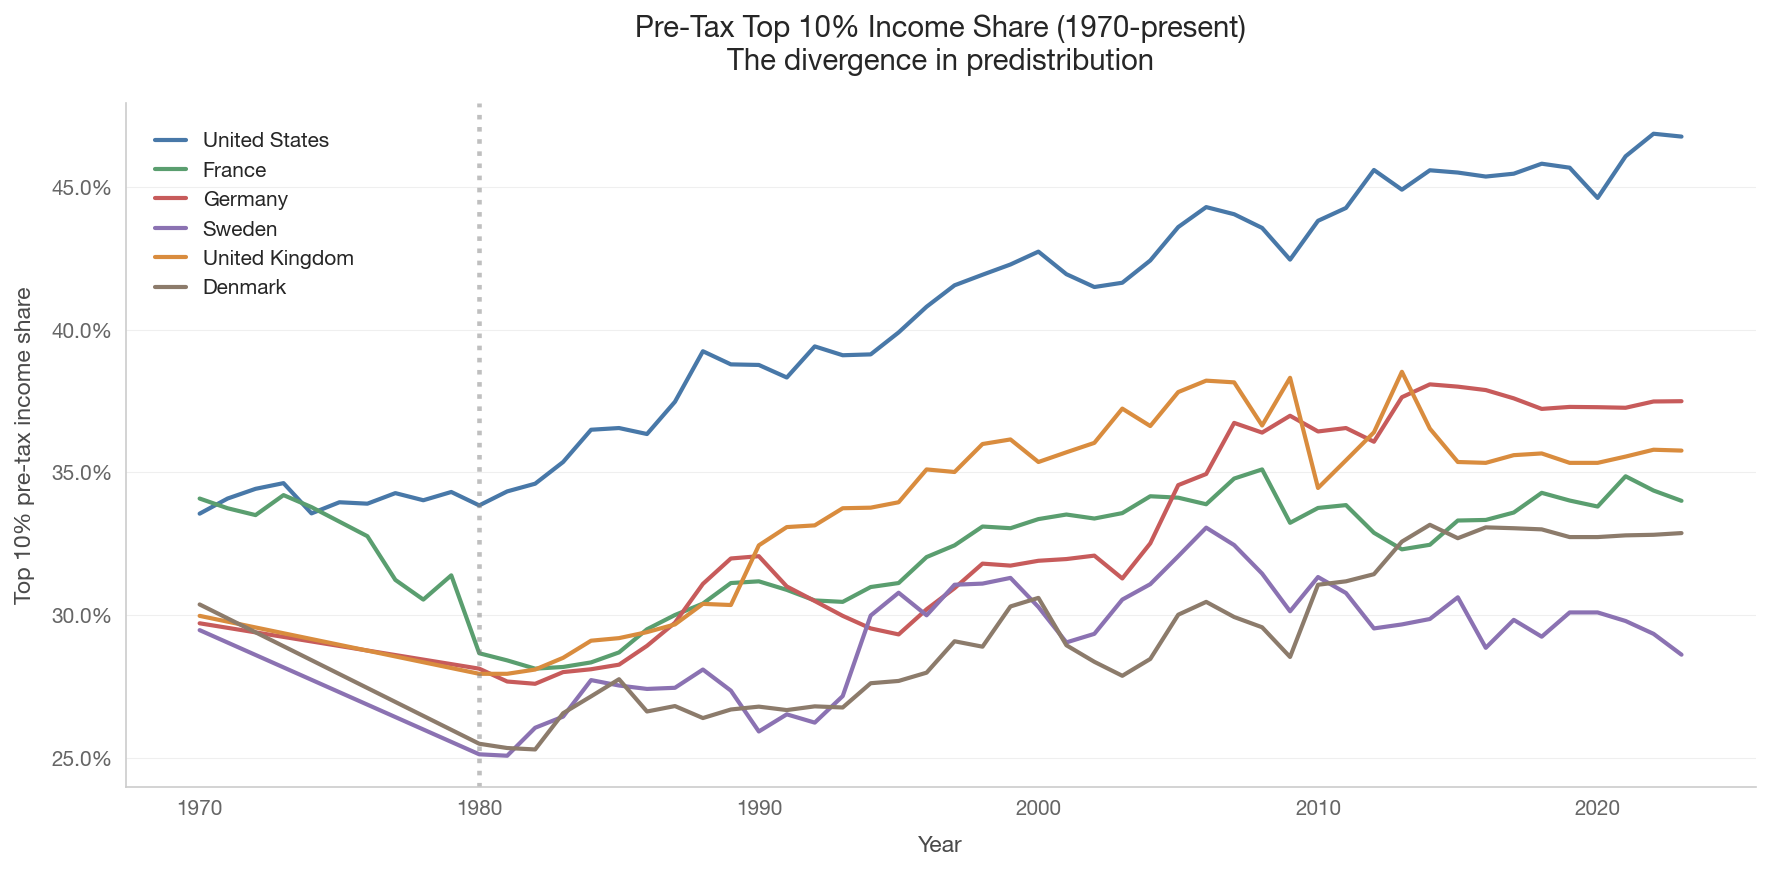
3. Pre-Tax Top 10% Share: The Divergence Since 1980

Before taxes and transfers, how much of national income goes to the top 10%? The US and Europe diverged sharply starting around 1980 — the US top 10% share soared while European shares remained relatively stable.

This divergence in predistribution is the phenomenon Blanchet et al. argue is the primary driver of the US-Europe inequality gap.

Show code
ts_countries = ['US', 'FR', 'DE', 'SE', 'GB', 'DK']

# Pre-tax top 10% share
pretax_top10 = wid.get_top_shares_timeseries(
    ts_countries, percentile='p90p100', concept='pretax', start_year=1970
)

if not pretax_top10.empty:
    fig, ax = plt.subplots(figsize=(12, 6))
    
    for cc in ts_countries:
        data = pretax_top10[pretax_top10['country'] == cc].sort_values('year')
        if not data.empty:
            ax.plot(data['year'], data['value'],
                    color=country_color(cc), linewidth=2,
                    label=country_name(cc))
    
    ax.yaxis.set_major_formatter(mtick.PercentFormatter(1.0))
    ax.set_xlabel('Year')
    ax.set_ylabel('Top 10% pre-tax income share')
    ax.set_title('Pre-Tax Top 10% Income Share (1970-present)\n'
                 'The divergence in predistribution', fontsize=14)
    ax.legend()
    ax.axvline(x=1980, color='gray', linestyle=':', alpha=0.5)
    
    plt.tight_layout()
    save_figure(fig, '02_pretax_top10_timeseries')
    plt.show()
else:
    print("WID data not available.")


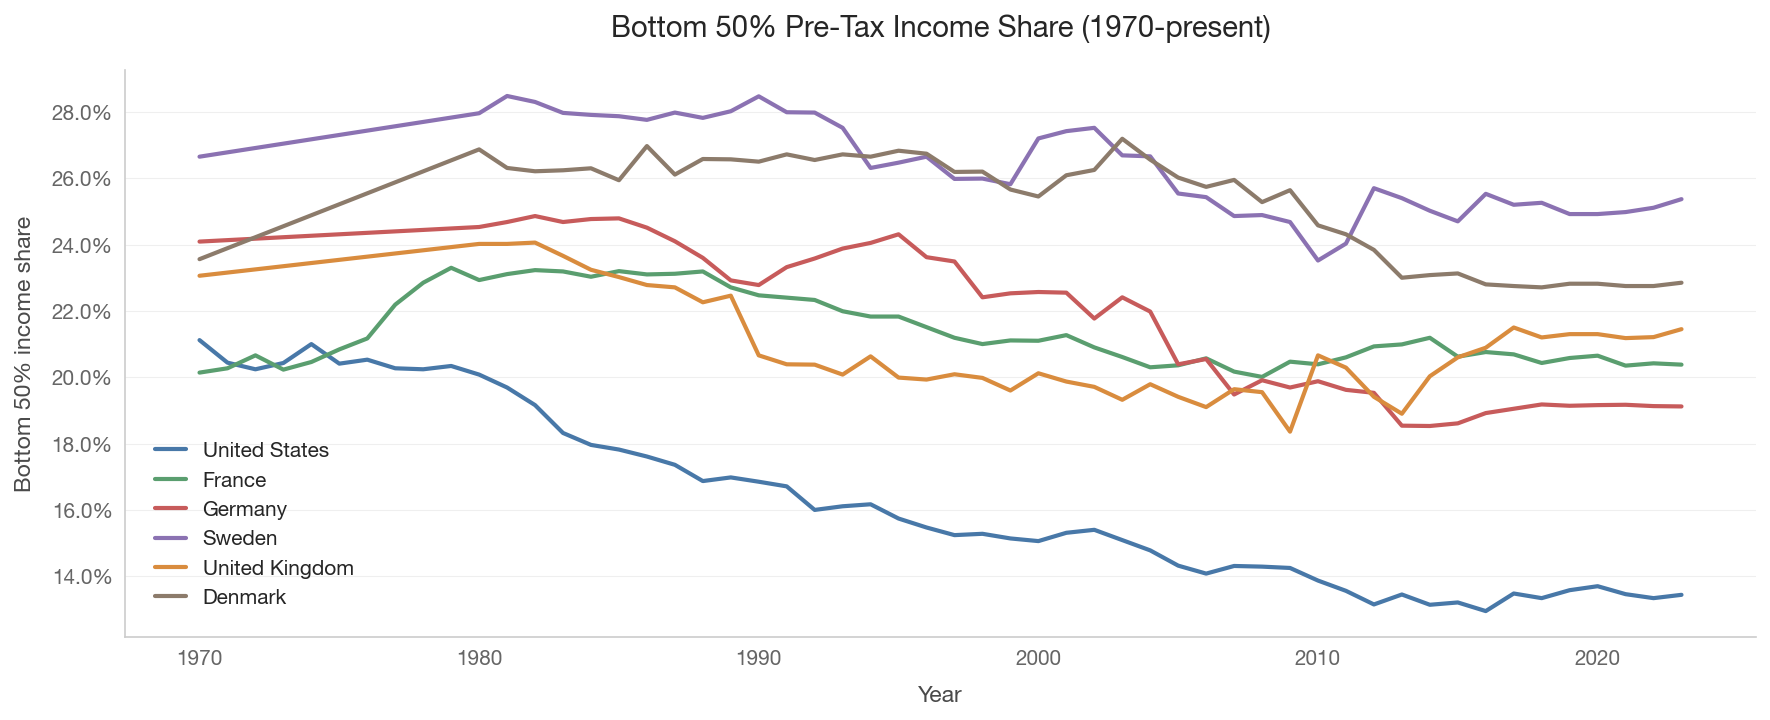
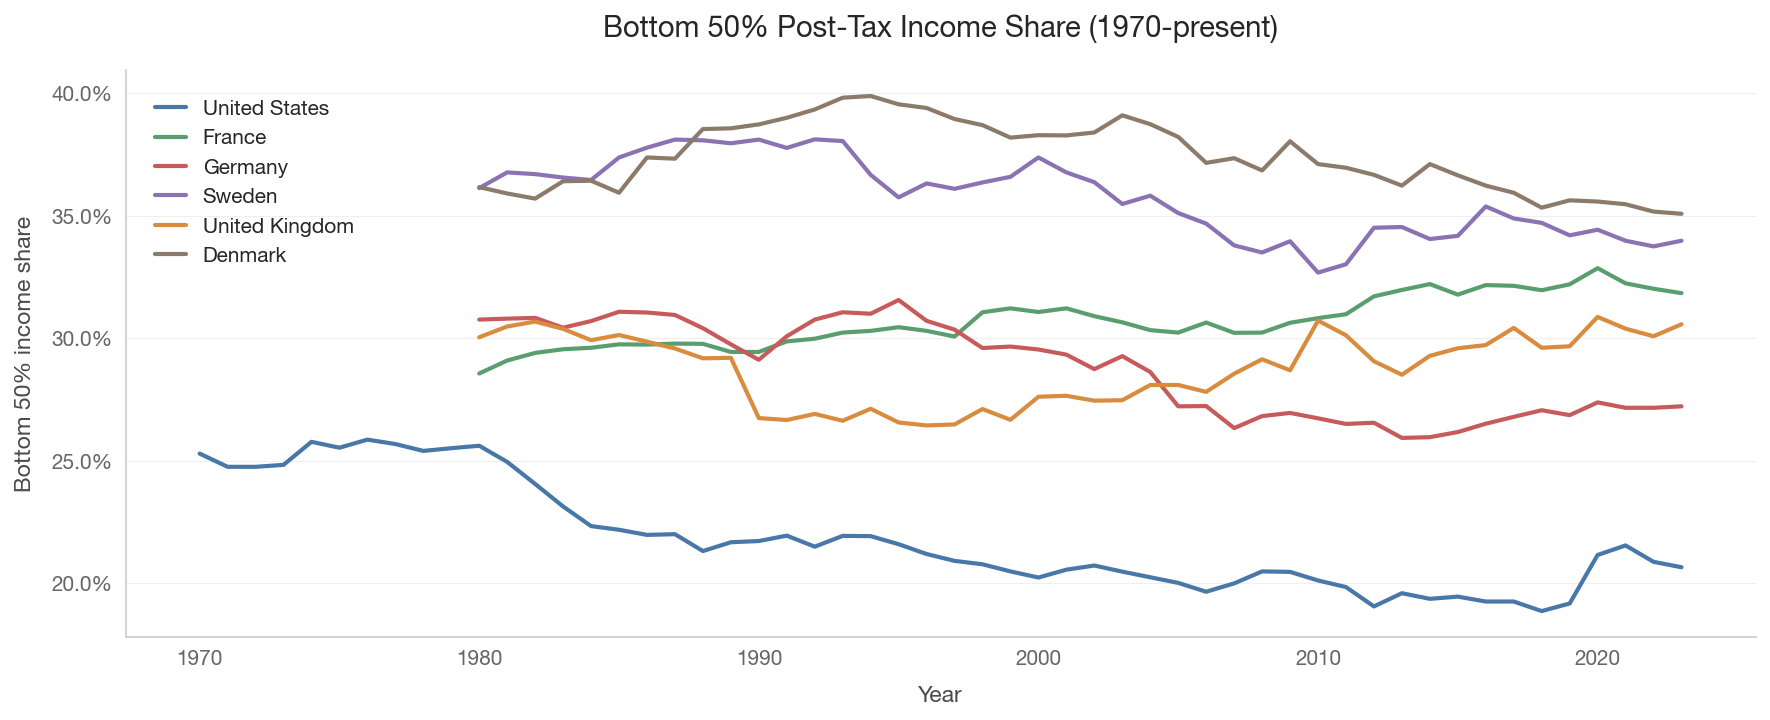
4. Bottom 50% Share: Pre-Tax vs. Post-Tax

The bottom 50%’s share of national income shows the flip side. How much of the pie goes to the poorer half of the population, before and after the tax-transfer system intervenes?

Show code
# Bottom 50% share: pre-tax vs post-tax
for concept, title_suffix in [('pretax', 'Pre-Tax'), ('posttax', 'Post-Tax')]:
    bottom50 = wid.get_top_shares_timeseries(
        ts_countries, percentile='p0p50', concept=concept, start_year=1970
    )
    
    if not bottom50.empty:
        fig, ax = plt.subplots(figsize=(12, 5))
        
        for cc in ts_countries:
            data = bottom50[bottom50['country'] == cc].sort_values('year')
            if not data.empty:
                ax.plot(data['year'], data['value'],
                        color=country_color(cc), linewidth=2,
                        label=country_name(cc))
        
        ax.yaxis.set_major_formatter(mtick.PercentFormatter(1.0))
        ax.set_xlabel('Year')
        ax.set_ylabel('Bottom 50% income share')
        ax.set_title(f'Bottom 50% {title_suffix} Income Share (1970-present)',
                     fontsize=14)
        ax.legend()
        
        plt.tight_layout()
        save_figure(fig, f'02_bottom50_{concept}_timeseries')
        plt.show()
    else:
        print(f"WID bottom 50% {concept} data not available.")


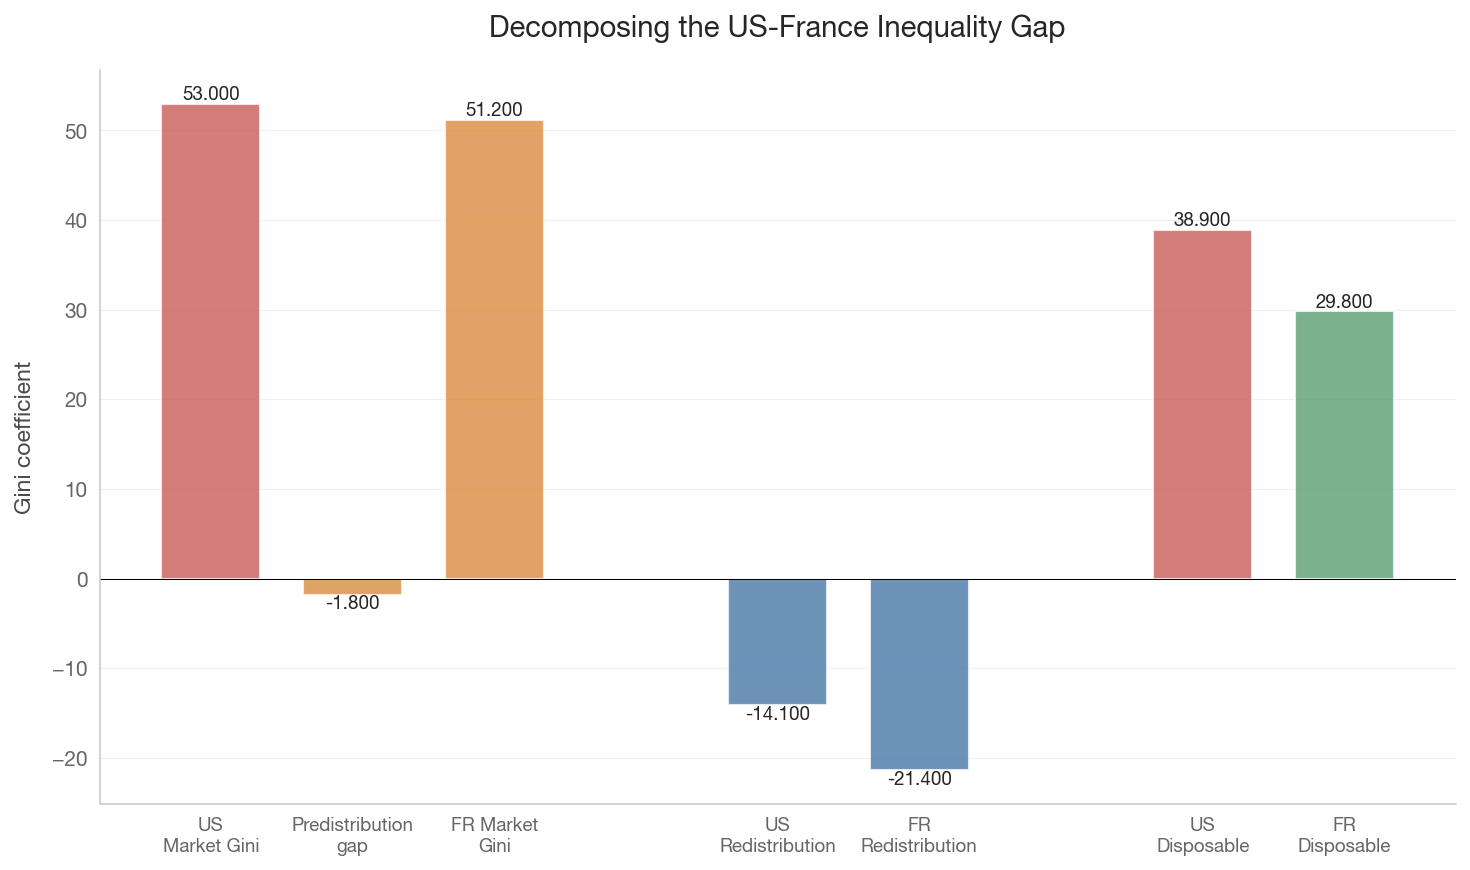
5. Decomposing the US-Europe Gap

How much of the US-Europe inequality gap is due to predistribution (different market income distributions) vs. redistribution (different tax-transfer systems)?

We compare the US to a European reference (France) at the pre-tax and post-tax levels.

Show code
# Compare US vs France: pre-tax and post-tax Gini
decomp_countries = ['US', 'FR', 'DE', 'SE']
decomp = swiid.get_redistribution(decomp_countries,
                                    start_year=2017, end_year=2022)

if not decomp.empty:
    latest = (decomp.sort_values('year', ascending=False)
              .groupby('country_code').first().reset_index())
    latest = latest[latest['country_code'] != ''].set_index('country_code')
    
    if 'US' in latest.index:
        fig, ax = plt.subplots(figsize=(10, 6))
        
        euro_countries = [c for c in decomp_countries if c != 'US' and c in latest.index]
        
        for ec in euro_countries:
            us_mkt = latest.loc['US', 'gini_mkt']
            us_disp = latest.loc['US', 'gini_disp']
            eu_mkt = latest.loc[ec, 'gini_mkt']
            eu_disp = latest.loc[ec, 'gini_disp']
            
            predist_gap = us_mkt - eu_mkt
            us_redist = us_mkt - us_disp
            eu_redist = eu_mkt - eu_disp
            redist_gap = eu_redist - us_redist
            total_gap = us_disp - eu_disp
            
            print(f"\nUS vs {country_name(ec)}:")
            print(f"  Total disposable Gini gap: {total_gap:.3f}")
            print(f"  Due to predistribution (market income gap): {predist_gap:.3f} "
                  f"({predist_gap/total_gap*100:.0f}%)" if total_gap > 0 else "")
            print(f"  Due to redistribution (tax-transfer gap): {redist_gap:.3f} "
                  f"({redist_gap/total_gap*100:.0f}%)" if total_gap > 0 else "")
        
        # Waterfall chart for US vs France
        if 'FR' in latest.index:
            us_mkt = latest.loc['US', 'gini_mkt']
            us_disp = latest.loc['US', 'gini_disp']
            fr_mkt = latest.loc['FR', 'gini_mkt']
            fr_disp = latest.loc['FR', 'gini_disp']
            
            categories = ['US\nMarket Gini', 'Predistribution\ngap',
                         'FR Market\nGini', 'US\nRedistribution',
                         'FR\nRedistribution',
                         'US\nDisposable', 'FR\nDisposable']
            values = [us_mkt, -(us_mkt - fr_mkt), fr_mkt,
                     -(us_mkt - us_disp), -(fr_mkt - fr_disp),
                     us_disp, fr_disp]
            
            x = [0, 1, 2, 4, 5, 7, 8]
            colors_bar = ['#c75b5b', '#d98c3e', '#d98c3e',
                         '#4878a8', '#4878a8',
                         '#c75b5b', '#5a9e6f']
            
            ax.bar(x, values, color=colors_bar, alpha=0.8, width=0.7)
            ax.set_xticks(x)
            ax.set_xticklabels(categories, fontsize=9)
            ax.set_ylabel('Gini coefficient')
            ax.set_title('Decomposing the US-France Inequality Gap', fontsize=14)
            ax.axhline(y=0, color='black', linewidth=0.5)
            
            # Add value labels
            for xi, vi in zip(x, values):
                ax.text(xi, vi + 0.01 * np.sign(vi), f'{vi:.3f}',
                        ha='center', va='bottom' if vi > 0 else 'top', fontsize=9)
            
            plt.tight_layout()
            save_figure(fig, '02_us_france_decomposition')
            plt.show()
else:
    print("SWIID redistribution data not available.")
US vs France:
  Total disposable Gini gap: 9.100
  Due to predistribution (market income gap): 1.800 (20%)
  Due to redistribution (tax-transfer gap): 7.300 (80%)

US vs Germany:
  Total disposable Gini gap: 8.500
  Due to predistribution (market income gap): 0.300 (4%)
  Due to redistribution (tax-transfer gap): 8.200 (96%)

US vs Sweden:
  Total disposable Gini gap: 10.000
  Due to predistribution (market income gap): 3.600 (36%)
  Due to redistribution (tax-transfer gap): 6.400 (64%)


Key Takeaways

  1. Both predistribution and redistribution matter. The US-Europe gap reflects differences in both market income distributions (predistribution) and in the aggressiveness of tax-transfer systems (redistribution).

  2. The US has higher pre-tax inequality AND less redistribution. The gap is compounded: the US starts from a more unequal market distribution and then does less to compress it.

  3. The Blanchet et al. finding depends on definitions. If you count social insurance as pre-tax income, predistribution dominates. If you count it as redistribution, the welfare state matters enormously. The empirical facts are not in dispute — the interpretive framework is.

  4. The pre-tax divergence since 1980 is striking. US top income shares surged while European shares were relatively stable, suggesting that labor market institutions (unionization, wage bargaining, minimum wages) play a major role.